Tutorial
Left Ventricular Ejection Fraction: Measurement Methods
Visual estimation versus Simpson's biplane method of discs for measuring left ventricular ejection fraction, and where each approach can mislead.
Written by [Author Name — replace before launch], RDCS — Clinical Echocardiography Educator
Medically reviewed by [Medical Reviewer Name — replace before launch], MD, FASE — Cardiologist
Published . Last reviewed .
 Placeholder image
Left ventricular ejection fraction (LVEF) is one of the most frequently reported echocardiographic measurements, and one of the most consequential — it drives diagnosis, prognosis, and treatment decisions across cardiology. This tutorial covers how it is measured and where each method can go wrong.
What Ejection Fraction Measures
EF is the fraction of the end-diastolic left ventricular volume ejected with each contraction:
EF (%) = [(EDV − ESV) ÷ EDV] × 100
where EDV is end-diastolic volume and ESV is end-systolic volume. It is a measure of global systolic function, not a direct measure of contractility, stroke volume, or cardiac output — a ventricle can have a normal EF with significantly reduced stroke volume if it is small, or the reverse in a dilated ventricle.
Visual Estimation
Experienced readers commonly estimate EF “by eye,” integrating an overall impression of wall motion and cavity size change across multiple views. In experienced hands, visual estimation correlates reasonably well with quantitative methods, particularly at the extremes (clearly normal or clearly severely reduced function). Agreement is weaker in the moderate-dysfunction range, where the visual difference between, for example, an EF of 40% and 45% is subtle and clinically significant.
Simpson’s Biplane Method of Discs
Placeholder image
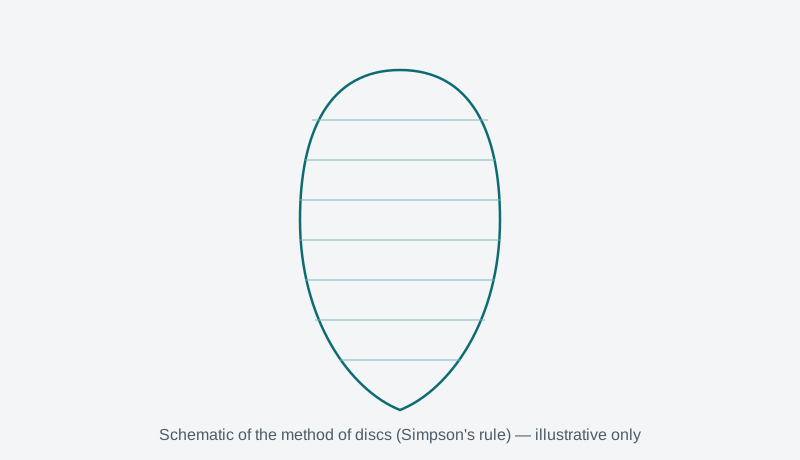
The modified Simpson’s biplane method is the standard 2D quantitative approach. The endocardial border is traced at end-diastole and end-systole in both the apical four-chamber and apical two-chamber views. The software divides the traced cavity into a stack of discs of equal height and sums their individual volumes (each treated as a cylinder) to estimate total LV volume at each time point — hence “method of discs.”
Accurate tracing requires:
- Non-foreshortened apical views, with the true LV apex — not a foreshortened, artificially blunted apex — included in the tracing.
- Careful border tracing that follows the blood-tissue interface, excluding papillary muscles from the cavity trace.
- Adequate endocardial definition; contrast enhancement should be considered when border definition is poor in two or more contiguous segments.
Common Sources of Error
- Apical foreshortening is the single most common and consequential error. A foreshortened apex makes the ventricle appear shorter and rounder than it truly is, which systematically overestimates EF.
- Poor endocardial border definition, especially in patients with a difficult body habitus, can force the reader to guess at the true border.
- Inconsistent frame selection for true end-diastole and end-systole affects both EDV and ESV, and therefore the calculated EF.
- Papillary muscle inclusion in the traced cavity artificially reduces measured volumes.
Beyond 2D: 3D Echocardiography and Strain
Three-dimensional echocardiography measures LV volumes without relying on the geometric assumptions of 2D methods and without the foreshortening risk inherent to a single 2D plane, and is increasingly preferred where image quality and equipment allow. Global longitudinal strain (GLS), derived from speckle-tracking analysis, offers a complementary, often more reproducible measure of systolic function that can detect subclinical dysfunction before EF declines — but a full discussion of strain imaging is outside the scope of this introductory tutorial.
References
- 1. Lang RM, Badano LP, Mor-Avi V, et al. Recommendations for Cardiac Chamber Quantification by Echocardiography in Adults. J Am Soc Echocardiogr. 2015;28(1):1-39.
- 2. Folland ED, Parisi AF, Moynihan PF, et al. Assessment of left ventricular ejection fraction and volumes by real-time, two-dimensional echocardiography. Circulation. 1979;60(4):760-766.
- 3. Thavendiranathan P, Grant AD, Negishi T, et al. Reproducibility of echocardiographic techniques for sequential assessment of left ventricular ejection fraction and volumes. J Am Coll Cardiol. 2013;61(1):77-84.