Tutorial
Aortic Stenosis: Echocardiographic Assessment
How to identify and grade aortic stenosis severity by echocardiography, including Doppler methods, guideline thresholds, and low-flow, low-gradient pitfalls.
Written by [Author Name — replace before launch], RDCS — Clinical Echocardiography Educator
Medically reviewed by [Medical Reviewer Name — replace before launch], MD, FASE — Cardiologist
Published . Last reviewed .
 Placeholder image
Aortic stenosis (AS) is the most common primary valve lesion requiring intervention in high-income countries, and echocardiography is the first-line and usually definitive test for diagnosis and severity grading. This tutorial walks through the 2D and Doppler assessment used to identify aortic stenosis and grade its severity in line with current ASE and ESC/EACTS guidance.
Etiology
In adults, the two dominant causes are calcific degeneration of a trileaflet valve — typically presenting after age 65 — and calcification of a congenitally bicuspid valve, which tends to present roughly a decade earlier. Rheumatic aortic stenosis is less common in regions with access to childhood rheumatic fever treatment, but remains relevant globally and almost always coexists with rheumatic mitral disease.
2D and Structural Findings
Before Doppler assessment, 2D imaging should characterize:
- Leaflet number and morphology — trileaflet versus bicuspid, and the degree of calcification and restricted leaflet excursion, best seen in the parasternal short-axis and long-axis views.
- Annulus and LVOT dimensions, measured in the parasternal long-axis view in mid-systole, which are required inputs for the continuity equation.
- Left ventricular wall thickness and function, since concentric hypertrophy is a common compensatory response to chronic afterload, and systolic dysfunction changes how severity should be interpreted.
Doppler Assessment of Severity
Three Doppler-derived parameters form the core of severity grading:
- Peak aortic jet velocity (Vmax) — obtained with continuous-wave Doppler, interrogating the valve from multiple windows (apical, right parasternal, suprasternal) to capture the true peak, since the jet direction is often eccentric and easy to underestimate from a single window.
- Mean transvalvular gradient — derived by the ultrasound system from the traced CW Doppler velocity curve using the simplified Bernoulli equation.
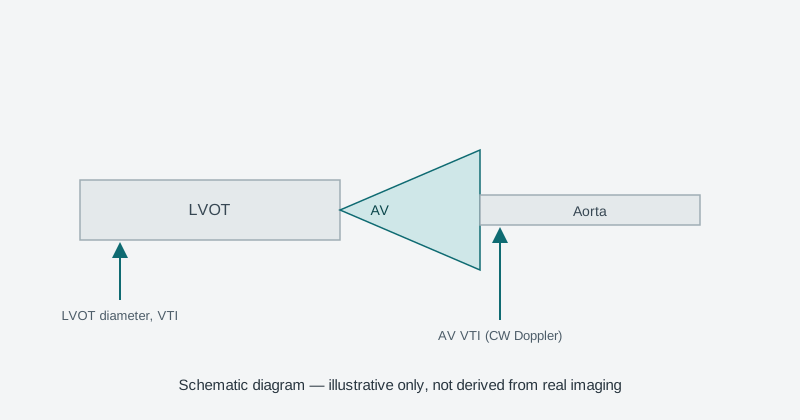
- Aortic valve area (AVA) by the continuity equation — calculated from the LVOT diameter, LVOT velocity-time integral (VTI), and aortic valve VTI:
 Placeholder image
AVA (cm²) = (LVOT area × LVOT VTI) ÷ AV VTI, where LVOT area is calculated from the measured LVOT diameter assuming a circular cross-section. Because diameter is squared in the area calculation, small measurement errors in LVOT diameter produce disproportionately large errors in the final AVA — this is the single most common source of continuity-equation inaccuracy in practice.
Echocardiographic assessment of aortic stenosis — video walkthrough
Placeholder — video to be addedRead video transcript
[00:00] Welcome to this overview of the echocardiographic assessment of aortic stenosis. [00:12] We'll cover the three key Doppler parameters: peak velocity, mean gradient, and aortic valve area by the continuity equation. [00:35] We'll also discuss why flow matters, and how low-flow, low-gradient disease can make grading severity more difficult. [01:05] This is placeholder transcript text for the video embed component and should be replaced with a real transcript before publication.
Grading Severity
Guideline-based thresholds from the ASE/EACVI focused update and the 2020 ACC/AHA and 2021 ESC/EACTS guidelines are broadly aligned:
| Severity | Peak velocity (m/s) | Mean gradient (mmHg) | AVA (cm²) |
|---|---|---|---|
| Mild | 2.6–2.9 | < 20 | > 1.5 |
| Moderate | 3.0–3.9 | 20–39 | 1.0–1.5 |
| Severe | ≥ 4.0 | ≥ 40 | ≤ 1.0 |
AVA can also be indexed to body surface area, with an indexed AVA ≤0.6 cm²/m² supporting a diagnosis of severe disease — particularly useful in patients whose body size falls well outside the population these absolute thresholds were derived from.
Low-Flow, Low-Gradient Aortic Stenosis
Because gradient is flow-dependent, a low stroke volume can produce a low gradient despite a genuinely small valve area. This scenario is generally divided into two patterns:
- Classic low-flow, low-gradient AS — reduced left ventricular ejection fraction (LVEF) with low stroke volume, where the gradient may underestimate true severity.
- Paradoxical low-flow, low-gradient AS — preserved LVEF but a small, hypertrophied, poorly compliant ventricle producing a reduced stroke volume despite normal-appearing systolic function.
In both patterns, an AVA ≤1.0 cm² with a mean gradient < 40 mmHg and a stroke volume index < 35 mL/m² should prompt further evaluation — commonly low-dose dobutamine stress echocardiography (to assess contractile/flow reserve and distinguish truly severe from pseudo-severe stenosis) or aortic valve calcium scoring by CT, which has sex-specific thresholds that support or argue against severe disease independent of flow state.
Common Pitfalls
- Missing the true peak velocity by relying on a single Doppler window — always interrogate from multiple acoustic windows.
- Mismeasuring the LVOT diameter, which is squared in the continuity equation and is a major source of error.
- Ignoring flow state when a gradient looks only moderately elevated in a ventricle with reduced stroke volume.
- Confusing pseudo-severe and truly severe AS in low-flow, low-gradient physiology without dobutamine stress testing or calcium scoring when the distinction changes management.
When to Refer
Guideline recommendations for intervention depend on symptom status, LVEF, severity, and exercise response, and are outside the scope of this tutorial — see the current ACC/AHA and ESC/EACTS valvular heart disease guidelines cited below for intervention thresholds and timing.
References
- 1. Baumgartner H, Hung J, Bermejo J, et al. Recommendations on the echocardiographic assessment of aortic valve stenosis: a focused update from the European Association of Cardiovascular Imaging and the American Society of Echocardiography. J Am Soc Echocardiogr. 2017;30(4):372-392.
- 2. Otto CM, Nishimura RA, Bonow RO, et al. 2020 ACC/AHA Guideline for the Management of Patients With Valvular Heart Disease. Circulation. 2021;143(5):e72-e227.
- 3. Vahanian A, Beyersdorf F, Praz F, et al. 2021 ESC/EACTS Guidelines for the management of valvular heart disease. Eur Heart J. 2022;43(7):561-632.
- 4. Pibarot P, Dumesnil JG. Low-flow, low-gradient aortic stenosis with normal and depressed left ventricular ejection fraction. J Am Coll Cardiol. 2012;60(19):1845-1853.
- 5. Clavel MA, Magne J, Pibarot P. Low-gradient aortic stenosis. Eur Heart J. 2016;37(34):2645-2657.